From cells to tissues – digital reconstruction of the liver in three dimensions
No cell is an island – we must always see cellular processes within the context of tissue. With an image-based computational approach, we can recreate the complex tissue architecture of the liver from microscopy data. We use our freely available image analysis software MotionTracking to analyze and reconstruct high-resolution light microscopy images and extract quantitative parameters (Morales-Navarrete et al., 2015). As a result, we could show that hepatocytes in mouse livers are not oriented randomly in the liver lobule, but are aligned along a common axis. We call this a long-range 3D liquid crystal order, a concept borrowed from engineering and used to describe e.g. liquid crystal displays (LCDs) in engineering (Morales-Navarrete et al., 2019, Scholich et al., 2022).
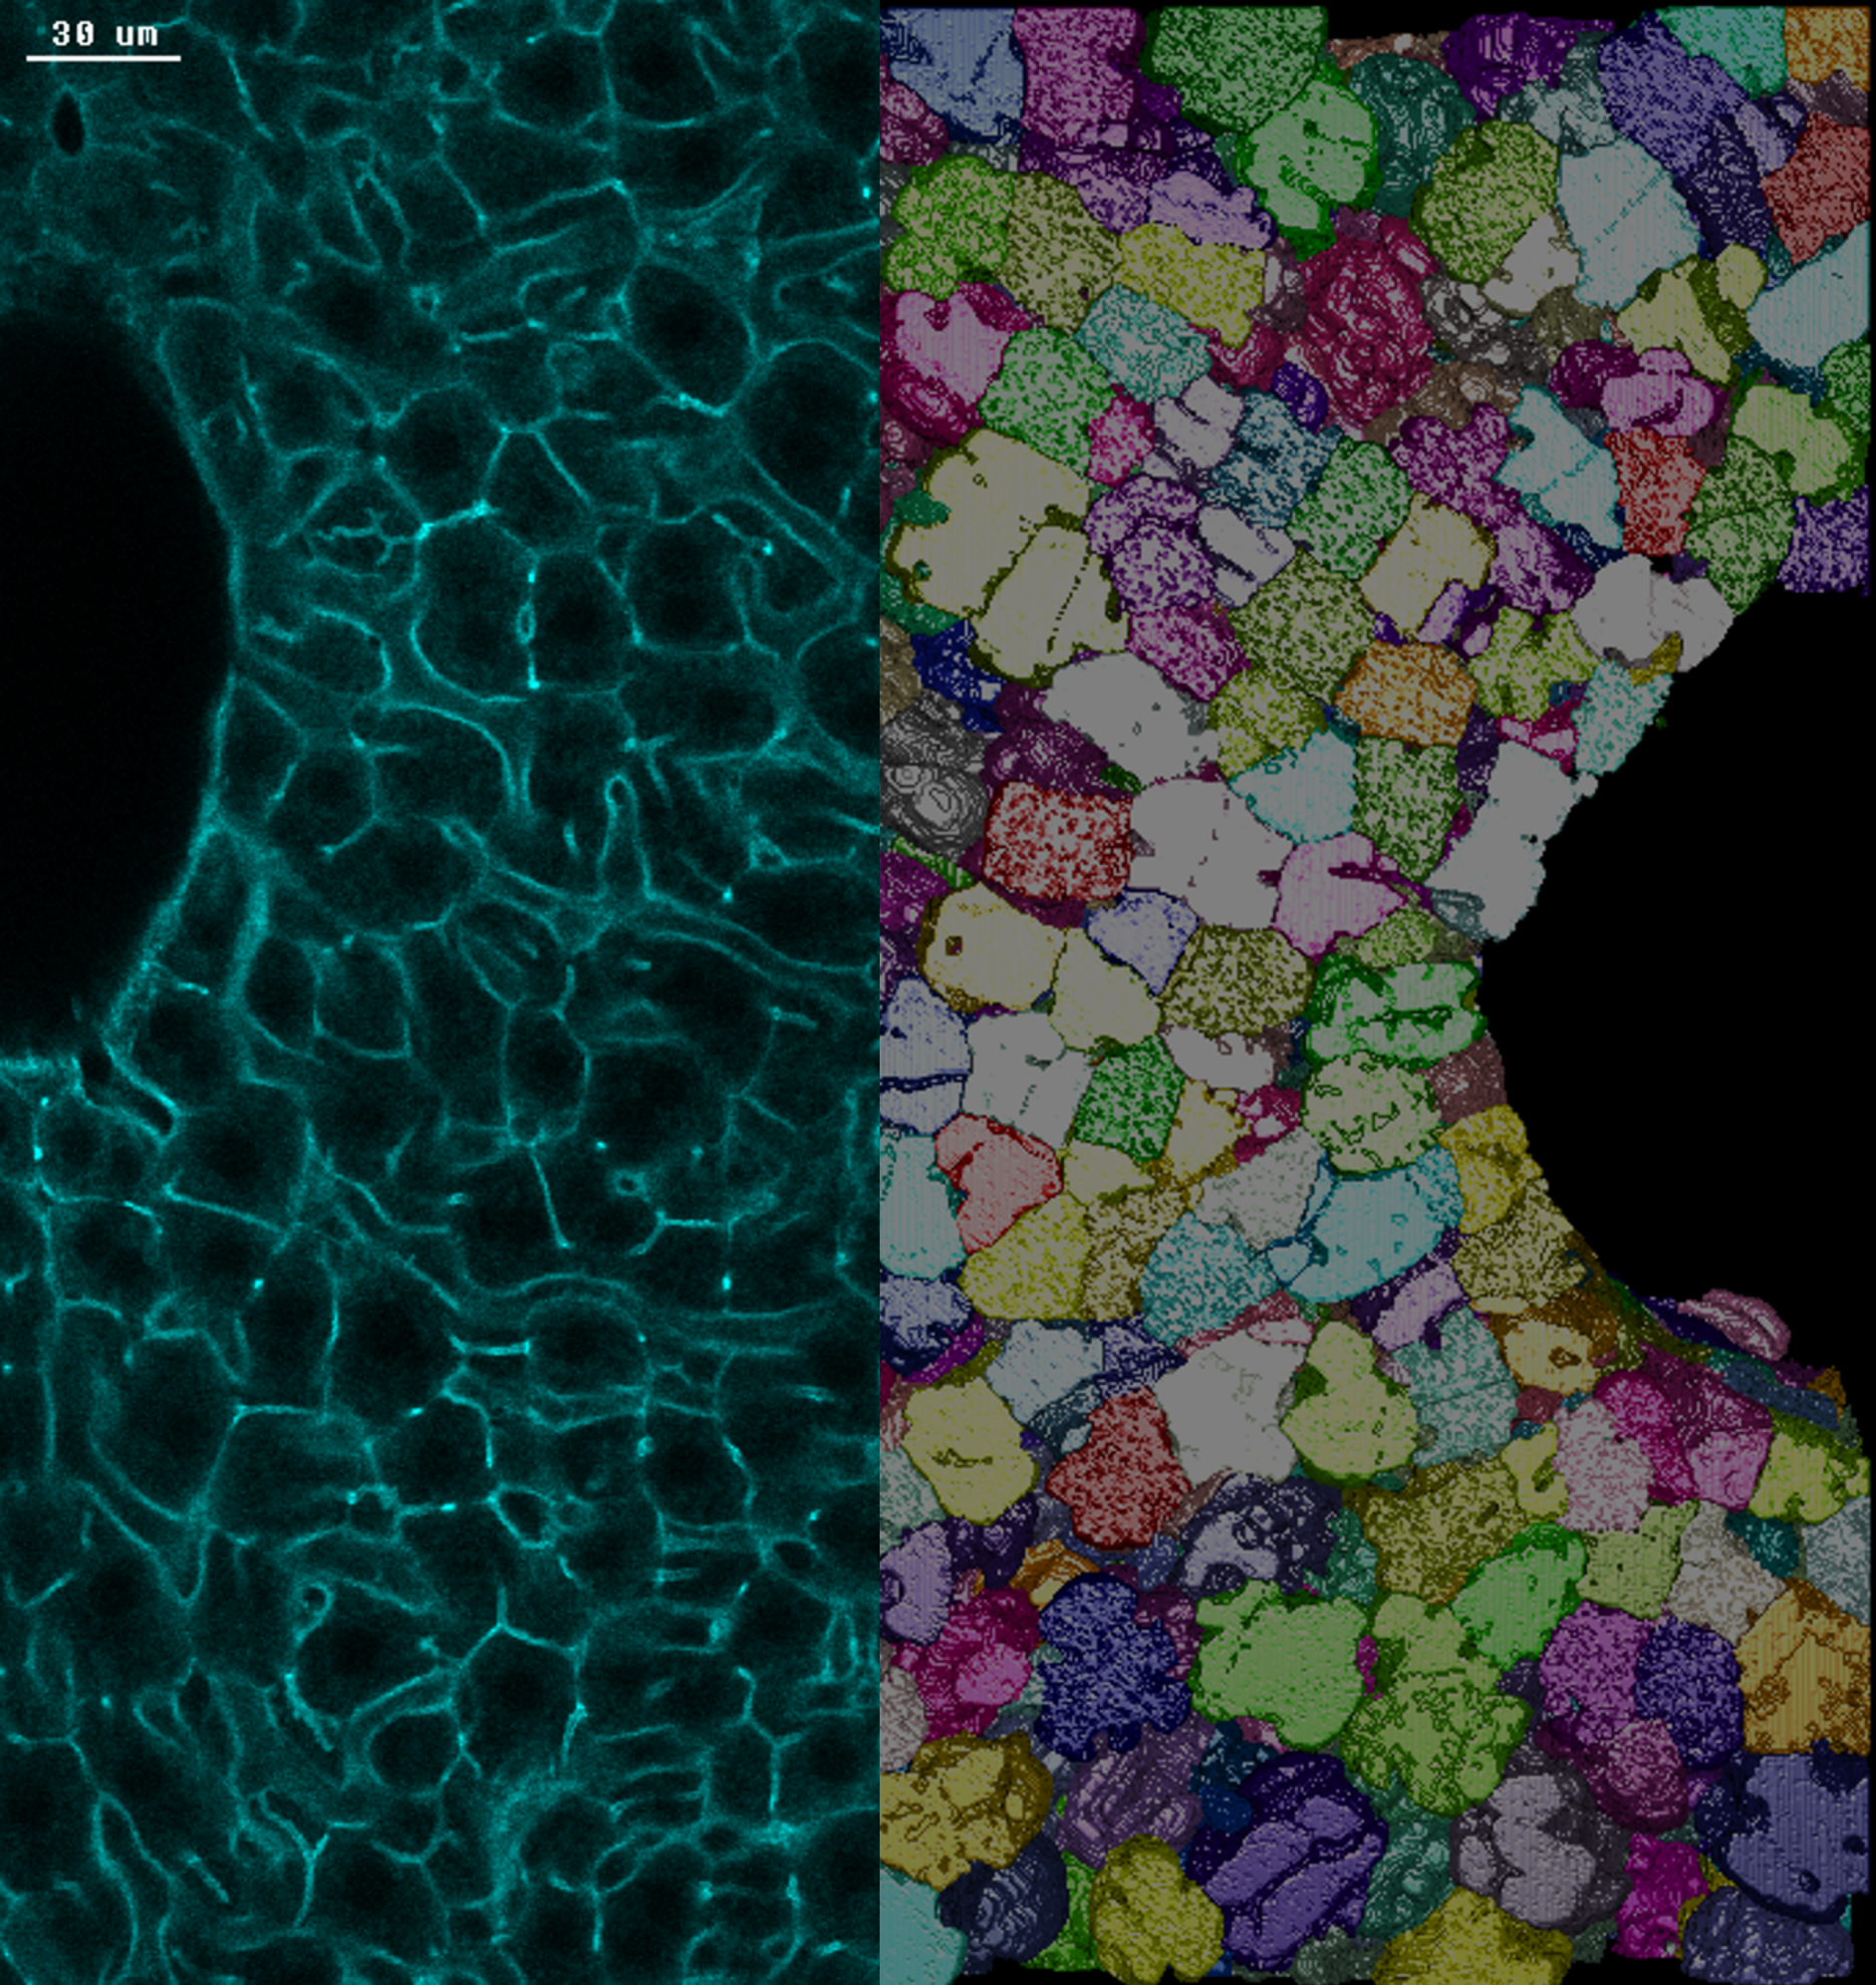
This video shows the reconstruction of a liver tissue sample. First, we see the original microscopy data that is followed by the digital reconstruction (sinusoids -magenta, bile canaliculi – green, nuclei – white/multiple colors, cells – multiple colors). Copyright: MPI-CBG.
Tissue organization in liver disease
We also use this workflow to describe tissue alterations in human liver disease from patient samples, for example in non-alcoholic fatty liver disease (NAFLD). We generated a three-dimensional computational model of human liver tissue at different disease stages and identified a set of structural cellular and tissue parameters that correlate with disease progression. We used these parameters and simulated their effects on biliary fluid dynamics in the liver. In our disease model, we predicted an increased pericentral biliary pressure and micro-cholestasis, which is consistent with measured elevated cholestatic biomarkers in patients’ blood. This data can help to identify new tissue biomarkers and signatures to describe disease stages in the clinic (Segóvia-Miranda et al., 2019).
We also used this method to correlate structural parameters of the bile canalicular network with measurements of bile transport by intravital microscopy in mice. The data showed inequalities in biliary geometry and hepatocyte transport activity throughout the organ. Based on this, our model predicts gradients of bile velocity and pressure in the liver lobule (Meyer et al., 2017).
Regulation of liver size during development and regeneration
As the saying goes, the liver grows with its tasks. But how do cells collectively sense the overall status of tissue, especially when something goes wrong?
When the liver is injured, it has the unique capacity to regrow. During this time, it faces the same workload in the body, but with less manpower. The regrowing organ can accumulate too much bile in the bile canaliculi and ducts which leads to a pressure increase. We found that under these circumstances the apical surface of hepatocytes which form the bile canaliculi network expand, and the hepatocytes reinforce their actomyosin cortex, probably to withstand the pressure increase.
Interestingly, the Hippo transcriptional co-activator YAP senses this reinforcement of the apical actomyosin cortex and travels to the nucleus to act on gene regulation. We interpret this behavior as a mechano-sensory trigger that activates YAP to enable the cell to respond to critical levels of bile acids (Meyer et al., 2020) and make the necessary cellular adjustments through transcriptional regulation.


